

As Head of Business Development and with responsibility for overseeing our Commercial Services at Cosmic, I spend a significant amount of time making decisions based on data.
Whether that’s understanding staff utilisation, monitoring service performance, reviewing board KPIs, planning capacity, evaluating programme outcomes or analysing staff feedback, data sits at the heart of almost everything we do.
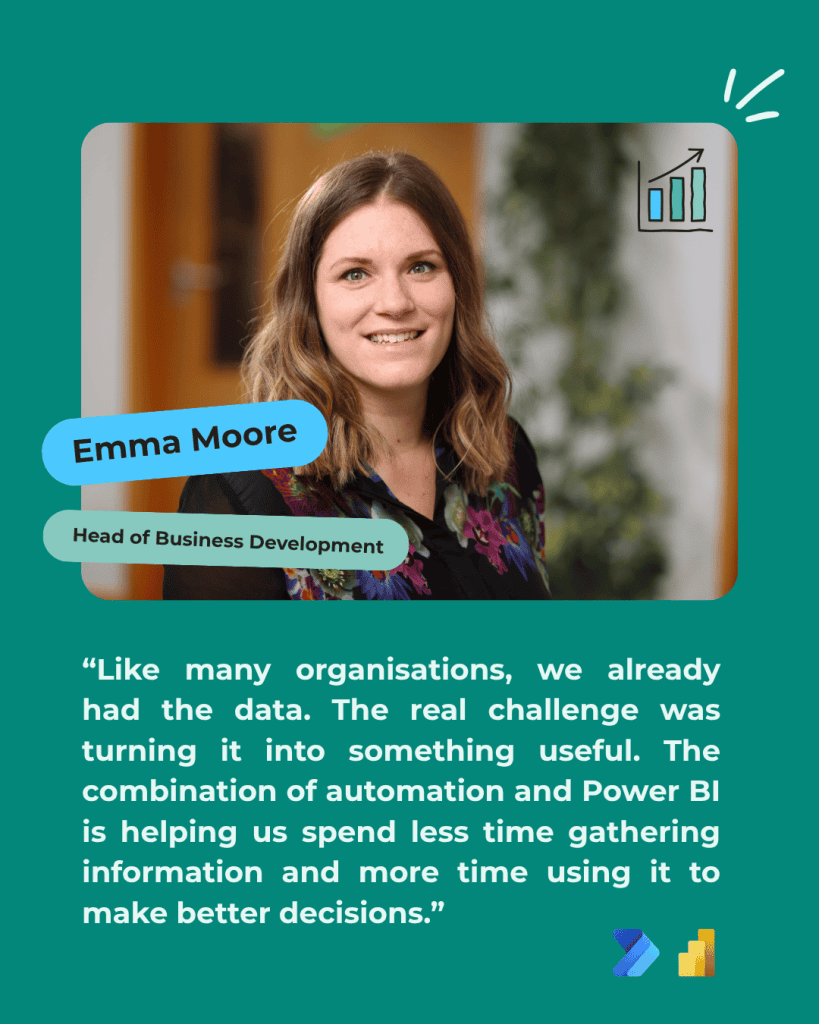
Like many organisations, we already had access to plenty of data. What often took longer was turning that information into something meaningful and easy to act on. Historically, that meant pulling information from different systems, reviewing spreadsheets, analysing reports and spending time trying to identify the story hidden within the numbers.
Over the past few months, however, that has begun to change. Working with our Senior Technical Consultant, Paul Turner, we’ve introduced automation, business intelligence and data visualisation into the way we work, and it has fundamentally changed how I access and use information. And if I’m honest, I couldn’t go back!
Seeing the Data Changes Everything
While the automation has been impressive, what has had the biggest impact for me is the way the information is presented.
Having data visualised through clear, interactive dashboards makes it much easier to spot trends, identify opportunities and ask better questions. Traditional reports contain a huge amount of information, but dashboards help bring that information to life. Instead of spending time searching for key insights, I can see them almost immediately and focus on what they mean for the organisation.
From Staff Surveys to Strategic Insight
Another area where we’ve seen huge potential is staff surveys. Anyone who has ever reviewed large volumes of survey responses will know how time-consuming it can be to identify common themes, compare responses over time and understand the bigger picture.
Using automation and reporting tools, we’re increasingly able to categorise responses, identify recurring themes and create visual comparisons between different survey periods. The real benefit isn’t simply the time saved. It means we can spend less time working through administration and more time focusing on the actions, conversations and improvements that make a difference to colleagues and the services we deliver.
The Real Value
What has impressed me most throughout this process is the combination of technical expertise and business understanding. The real skill lies in understanding a business process, identifying inefficiencies, spotting opportunities for improvement and then creating solutions that people will actually use. In Paul’s case, that has meant developing tools that don’t just present data, but help managers and leaders use it more effectively. That combination of technical and commercial thinking is incredibly powerful and increasingly important for organisations of every size.
As someone responsible for both business development and oversight of our commercial services, having easy access to live performance data has changed the way I work. Instead of requesting reports and waiting for information to be pulled together, I can explore the data myself, monitor trends in real time and make decisions with far greater confidence. The dashboards have given me greater visibility of performance, utilisation, capacity and organisational trends, helping me focus conversations on improvement rather than information gathering.
I’ve seen many new technologies emerge throughout my career. However, very few have had such an immediate and practical impact on my day-to-day work as the combination of automation, data visualisation and AI. The dashboards themselves are impressive, but the change in how we work as a result is where the real value and impact lies. We now have better visibility of our data, greater confidence in the information available to us and more time to focus on delivering value for our clients and communities.
Skills Bootcamps from Cosmic
If reading this has made you think about the amount of time your organisation spends producing reports, analysing spreadsheets or manually moving information between systems, I would encourage you to explore what is possible through automation, Power Platform tools and AI.
The skills behind these solutions aren’t reserved for technical specialists. They’re practical, learnable skills that can help organisations improve productivity, strengthen decision-making and unlock greater value from the data they already hold.
At Cosmic, we teach these capabilities through our funded Power Platform Skills Bootcamps, covering Power BI, Power Automate, Power Apps and Copilot Studio.
You could learn how to:
- Turn days of manual reporting into hours through automation
- Create live dashboards that replace static spreadsheets and reports
- Gain real-time visibility of staff performance, utilisation, capacity and KPIs
- Automate repetitive administrative processes
- Analyse large volumes of survey, customer or operational data quickly and consistently
- Reduce duplication and improve data accuracy
- Give managers and leaders faster access to the information they need to make decisions
- Create bespoke business tools without the need for complex software development
The programme is now entering its final funded cohorts. The final cohort starting in October. There is currently no confirmed follow-on funding, making these the last opportunities to access this training through the current programme.
Stories from our learners:
- Moving from manual financial reporting to automated dashboards and real-time insights (Tony Benger attended Power Platform Skills Bootcamp)
- Saving hours of administrative time through automation and process redesign (C&O Tractors attended Power Platform Skills Bootcamp)